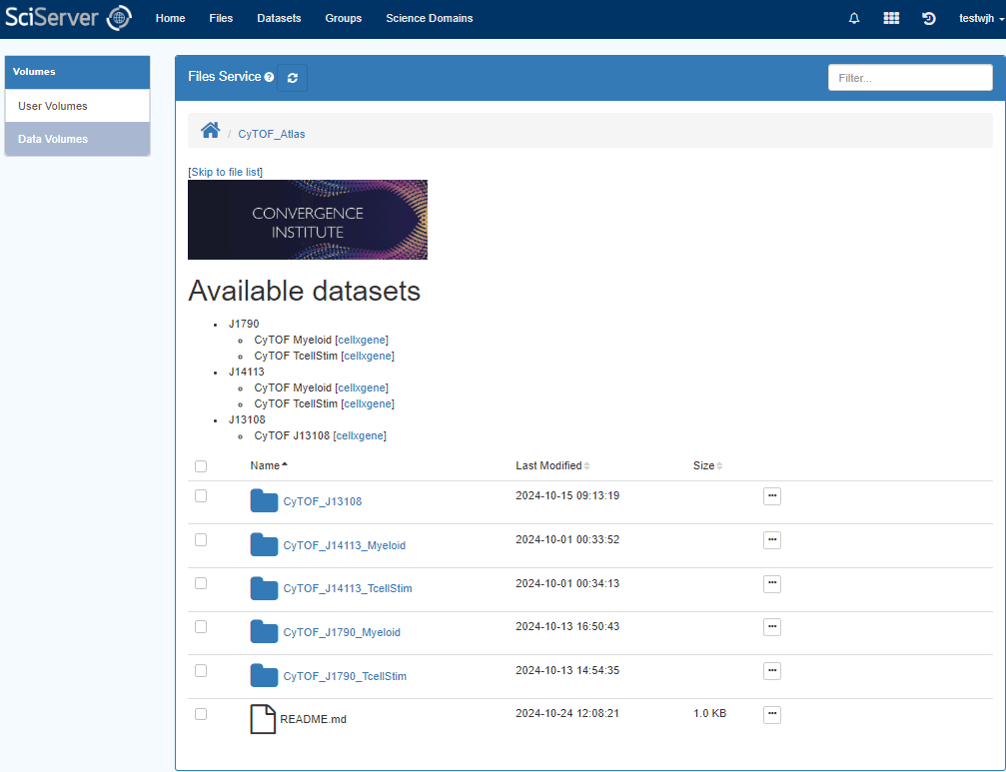
CyTOF_Atlas
Description
The data volume CyTOF_Atlas stores the datasets used for the Pancreatic cancer immunotherapy study, which curates a single cell proteomics atlas of human PBMCs from three combination immunotherapy clinical trials in metastatic PDAC patients to disentangle individual effects of cancer vaccines, GVAX and CRS-207, and immune checkpoint blockade therapies, anti-PD-1, and anti-CTLA-4.
The data volume is protein-level annotated from immunotherapy-treated cancer patients and serves the purpose of enabling non-computationally inclined immunologists and cancer biologists to explore the datasets and computational applications.
Accessing the Public Data Volumes
The following instructions will show you how to gain access to the CyTOF_Atlas data volumes and provide you with a brief orientation of volume-specific analysis tools and functionalities to get you started.
General information on how to use the SciServer platform may be found in the Help section of this website.
Create and Verify a SciServer Account
A SciServer account is required to access the CyTOF_Atlas data. If you do not yet have an account, you may register for one at the SciServer Registration page. Once logged into SciServer, users will have access to virtual machines that include Jupyter notebooks and pre-installed software packages for genomic data analysis.
Please note that in order to log into SciServer for the first time, you will need to verify your account by following the link emailed at account creation.
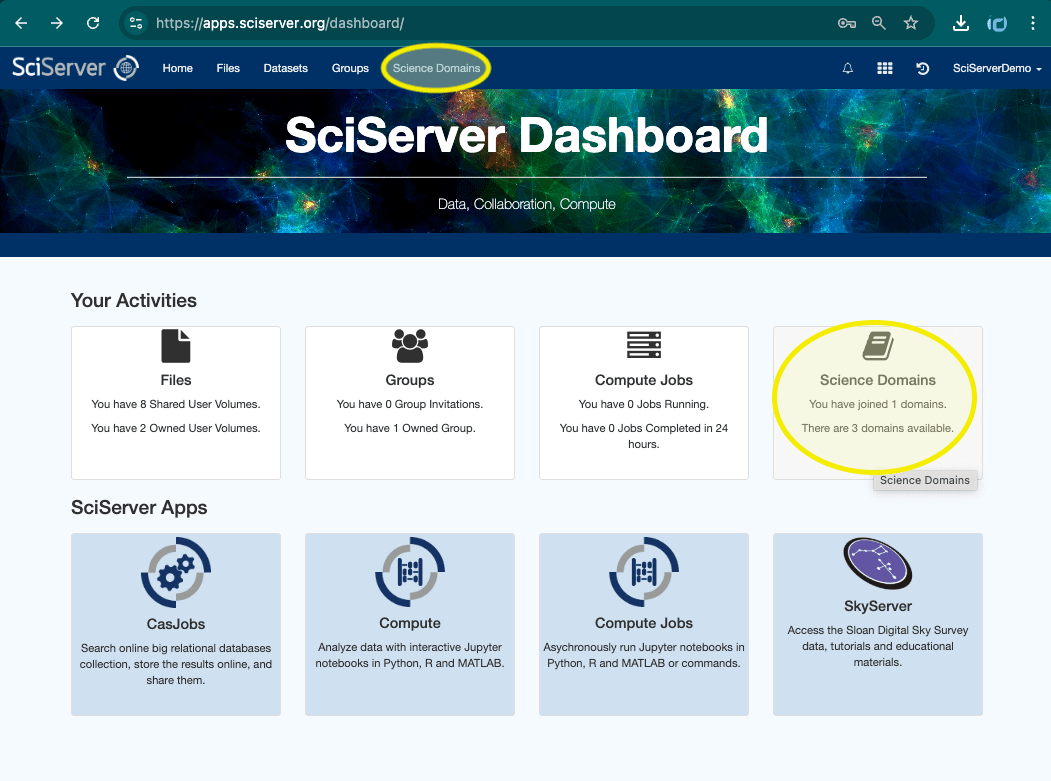
Join the Genomics Domain in SciServer
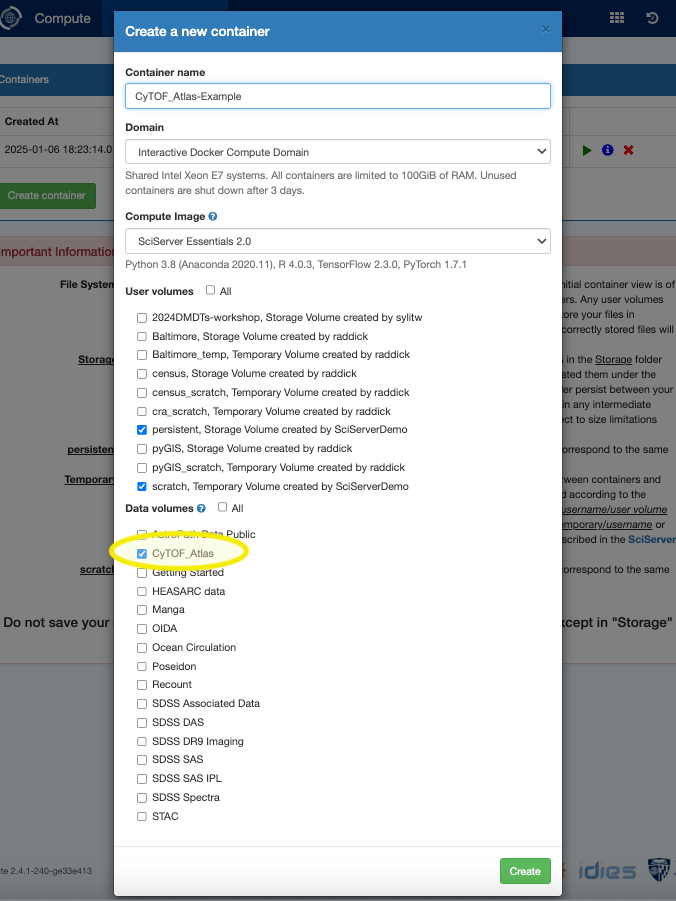
To gain access to CyTOF_Atlas data volumes, make sure you’re logged into your SciServer account, and click on the Science Domains tab in the SciServer dashboard (accessible via the dashboard icon or the top navigation).
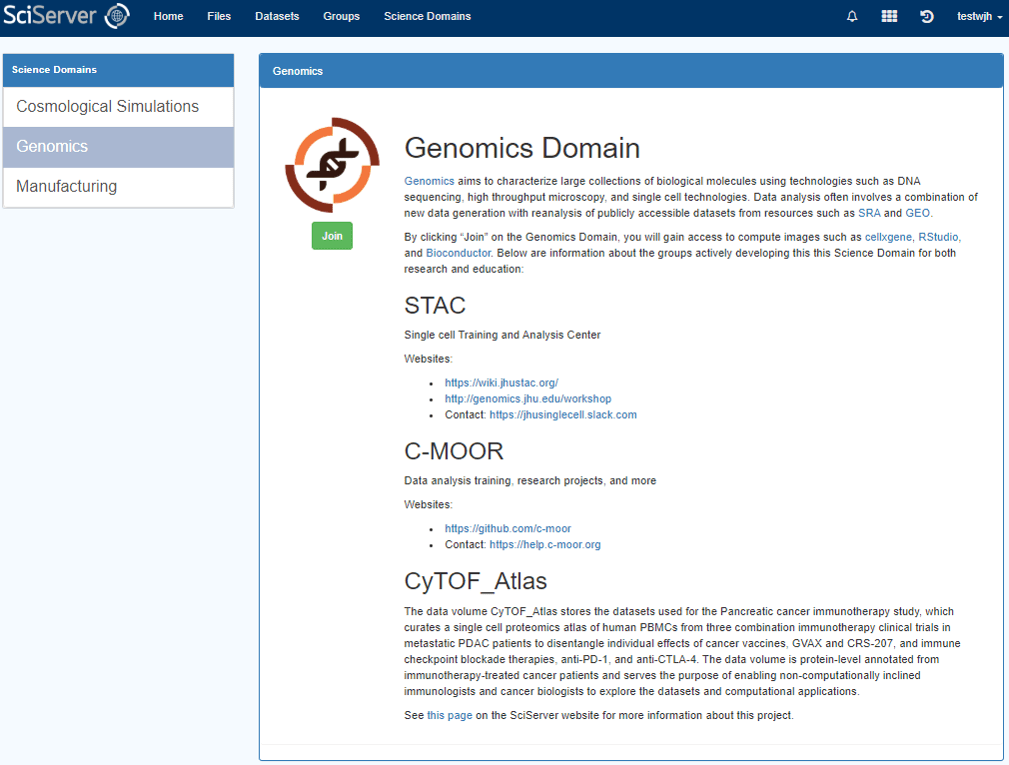
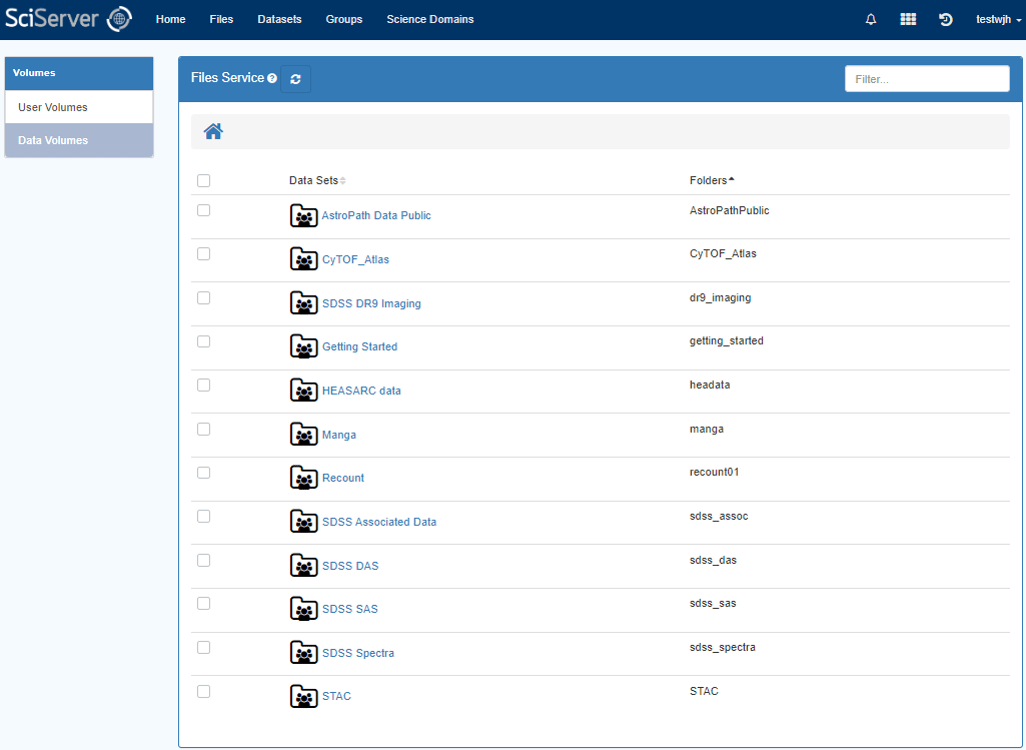
On the science domains page, select the Genomics entry and click the “Join” button on the right. Now you should see the CyTOF_Atlas data volume under the Files tab, and it will also be available to be mounted when you create a Compute container.
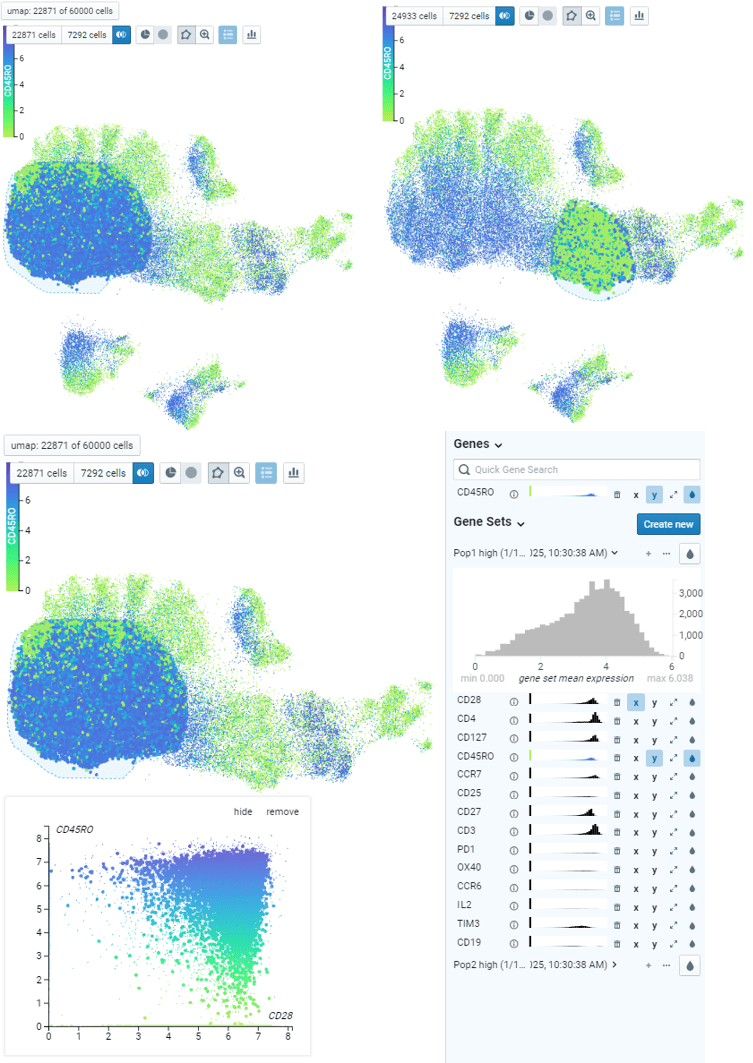
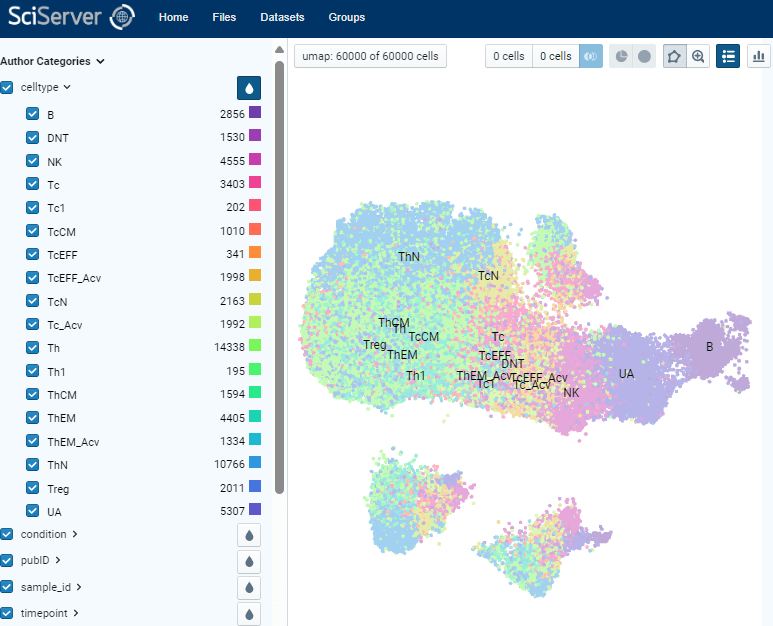
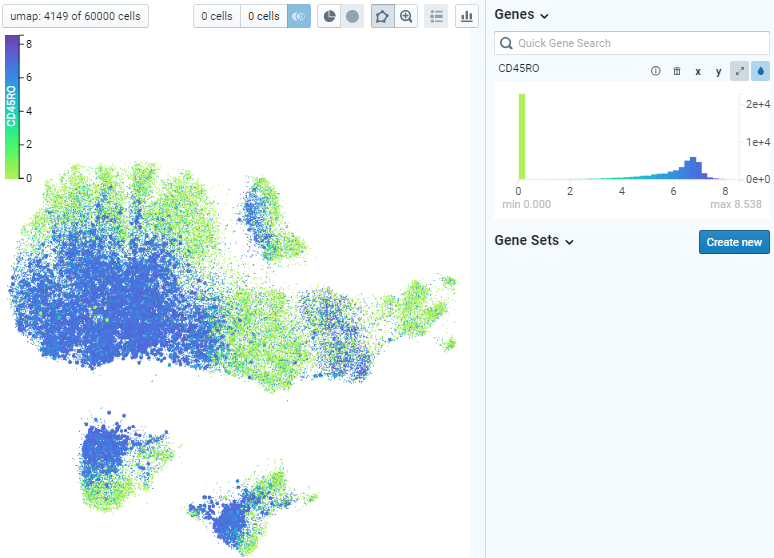
Example of Direct Data Exploration and Analysis
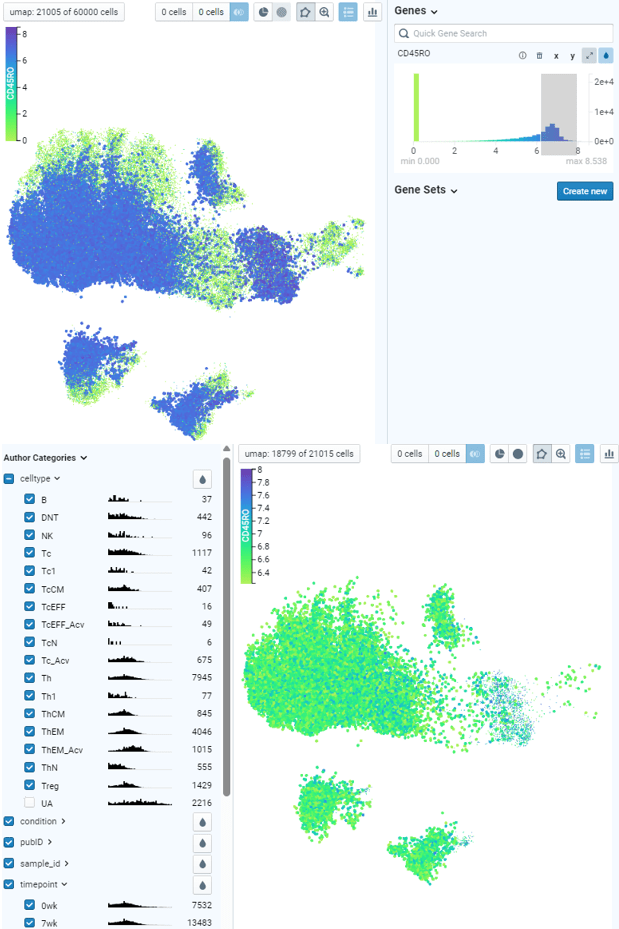
1. Data can be explored by T cell-focused phenotyping based on fully annotated clusters.
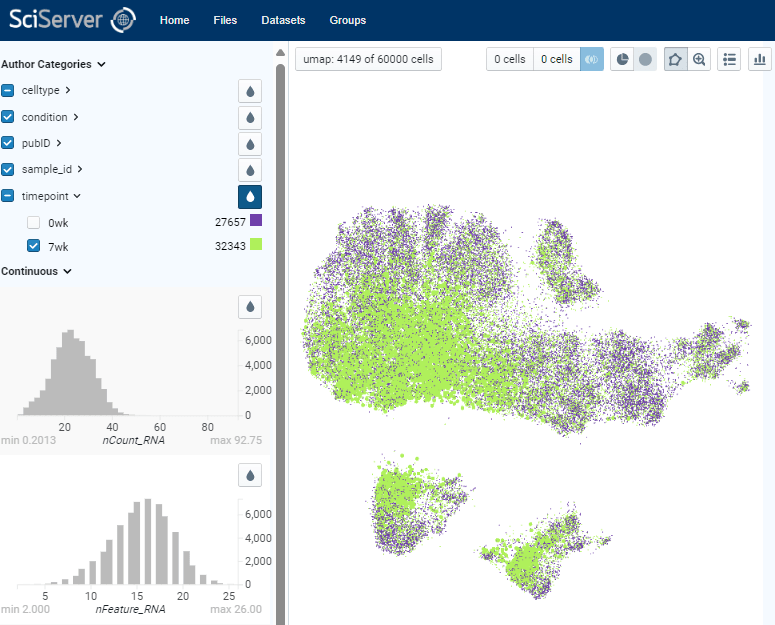
2. Data can be selected and colored based on timepoint of when the sample was obtained: 7 weeks on-treatment is shown.
3. Using the gene selection tool on the right panel, data can also be evaluated based on the expression of a marker of interest: CD45RO, a marker for T cell memory is shown.
4. By expression-based gating, abundance of cell type can be appreciated directly on the left panel: CD45ROhi T cells are predominantly located within memory cell types (ThEM, ThEM_Acv), and 7 week timepoint.
5. Manual gating of specific cell subsets can be done using polygon tool. By assigning two populations of interest, differential analysis can be done to identify top markers that are enriched in each population. Expression of those markers can be plotted on x-y coordinates also for further exploration.